2019/01/19

Arduino: Hello World with blinking LED

This tutorial shows how to display "Hello World" by Arduino and blink the built-in LED on the Arduino board or blink an external LED via wire connections.

Before working on this example, make sure you understand the pure Hello World example for Arduino.

Part A. Arduino built-in LED

1. Select File->Examples->01.Basics->Blink

2.  Modify the code as:

int count=0;
void setup() {
  Serial.begin(9600);
  // initialize digital pin LED_BUILTIN as an output.
  pinMode(LED_BUILTIN, OUTPUT);
}

// the loop function runs over and over again forever
void loop() {
  digitalWrite(LED_BUILTIN, HIGH);   // turn the LED on (HIGH is the voltage level)
  Serial.println("Hello, world!");
  delay(1000);                       // wait for a second
  digitalWrite(LED_BUILTIN, LOW);    // turn the LED off by making the voltage LOW
  Serial.println(count);
  delay(1000);                       // wait for a second
  count++;
}

3. Download the code and open the serial monitor

Result:


You should also see the LED on the Arduino board blinking.

Part B. External LED

1. Follow the figure shown in the official page for circuit connections from pin 13 to ground (GND) via an LED. Connect the longer leg / pin of the LED (called the anode) to the pin 13 with 5V power. The resistor value should be between 220 ohm and 1k ohm, but for me 2k ohm also works.

2. Modify the code as below:

int count=0;
int LED13=13; // For the external LED at pin 13
void setup() {
  Serial.begin(9600);
  // initialize digital pin LED_BUILTIN as an output.
  pinMode(LED_BUILTIN, OUTPUT);
  pinMode(LED13, OUTPUT);
}

// the loop function runs over and over again forever
void loop() {
  digitalWrite(LED_BUILTIN, HIGH);   // turn the LED on (HIGH is the voltage level)
  digitalWrite(LED13, HIGH);   // turn on the external LED at pin 13
  Serial.println("Hello, world!");
  delay(1000);                       // wait for a second
  digitalWrite(LED_BUILTIN, LOW);    // turn the LED off by making the voltage LOW
  digitalWrite(LED13, LOW);         // turn off the external LED at pin 13
  Serial.println(count);
  delay(1000);                       // wait for a second
  count++;
}

Result:


Reference:

Arduino: Hello, World! (StudyEECC)

Arduino: Hello, World!

This is the first tutorial with Arduino. "Hello World" is usually the very first program to learn a new programming language with a simple command that prints out the "Hello, World!" message.

2. Connect the Arduino board to your computer via a USB cable. Note that in this case the power of the Arduino board is supplied by the 5V USB cable and it is not required to connect to an external DC adapter.

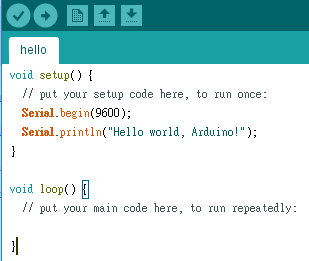
3. In the Arduino IDE window, type the following code:

void setup() {
  // put your setup code here, to run once:
  Serial.begin(9600);
  Serial.println("Hello world, Arduino!");
}

void loop() {
  // put your main code here, to run repeatedly:
}


3. Select Tools -> your Arduino board such as the popular Arduino Uno.

4. Select Tools -> COM port.

5. Select the upload button and save the project.

6. Select Tools -> Serial monitor.

7. You should see the result if the serial monitor is properly set.

Reference:

Hello World
Arduino: Hello World with blinking LED (StudyEECC)

Hello World with TensorFlow

After TensorFlow is installed, you may test the Hello World with commands in Python:

Type python to enter the Python environment:

python

Type the following commands

>>> import tensorflow as tf
>>> hello = tf.constant('Hello, World!')
>>> sess = tf.Session()
>>> sess.run(hello)
b'Hello, World!'
>>> 


Note that b'Hello, World!' represents byte literals.

If you want to print the message in a python file, use this command:

print(sess.run(hello))

Reference:

helloworld.py (GitHub:aymericdamien/TensorFlow-Examples)
What does the 'b' character do in front of a string literal? (Stack Overflow)

2019/01/08

Matlab: FIR comb filter with various zero placement

The following Matlab code tests the effects of different number of zeros and checks the linear phase result.

a = 1;

b1 = [1 -1];

zplane(b1,a);
fvtool(b1,a);
LinPhase1 = islinphase(b1,a) %Check if linear phase

%Notch comb filter
b2 = [1 0 -1]; 
zplane(b2,a);
fvtool(b2,a);
LinPhase2 = islinphase(b2,a) %Check if linear phase

%Notch comb filter
b3 = [1 0 0 -1]; 
zplane(b3,a);
fvtool(b3,a);
LinPhase3 = islinphase(b3,a) %Check if linear phase

%Notch comb filter
b4 = [1 0 0 0 -1];
zplane(b4,a);
fvtool(b4,a);

%Notch comb filter
b5 = [1 0 0 0 0 -1];
zplane(b5,a);
fvtool(b5,a);
LinPhase5 = islinphase(b5,a) %Check if linear phase

Result:

LinPhase1 =

  logical
   1

LinPhase2 =

  logical
   1

LinPhase3 =

  logical
   1

LinPhase5 =

  logical
   1

b1 = [1 -1];


b2 = [1 0 -1]; 


b3 = [1 0 0 -1]; 


b4 = [1 0 0 0 -1]; 

 b5 = [1 0 0 0 -1]; 


2019/01/01

Matlab: IIR Comb Notch or Peak Filter

IIR Comb Notch Filter

fs = 600;
fo = 100;
q = 35;
bw = (fo/(fs/2))/q;
[b,a] = iircomb(fs/fo,bw,'notch'); % Note type flag 'notch'
fvtool(b,a);
zplane(b,a);

Magnitude Response


Phase Response
Pole-Zero Diagram


IIR Comb Peak Filter

Replace the 'notch' string by 'peak':

[b,a] = iircomb(fs/fo,bw,'peak'); % Note type flag 'peak'

Magnitude Response


Phase Response

Pole-Zero Diagram


Reference


iircomb (MathWorks)

2018/12/20

Matlab: Find the index/row and column of the maximum element of a matrix

To find out the index of the maximum element of a matrix in Matlab, use:

>> myMat = [1 2 3 4;2 3 4 5;5 6 2 1]

myMat =
     1     2     3     4
     2     3     4     5
     5     6     2     1

>> [row, col] = find(myMat == max(myMat(:)))

row =
     3


col =
     2

>> myMat(3,2)

ans =
     6

>> max(myMat(:))

ans =
     6

Reference

How do I find the indices of the maximum (or minimum) value of my matrix? (MathWorks)

2018/12/15

Matlab: Frequency response and pole-zero plot of a 1000-Hz Butterworth lowpass filter

The following Matlab code shows the magnitude and phase response and the Z-plane of a 1000-Hz Butterworth lowpass filter.

clc;clear;close all;

Fs = 8000;  %Sampling frequency
Fco = 1000; %Cutoff frequency
order = 4;
[b, a] = butter(order, Fco/(Fs/2), 'low');

zplane(b,a);title(['LPF Fco=',num2str(Fco),'Hz, Fs=',num2str(Fs),'Hz']);

w = 0:0.01:2*pi;

H = freqz(b, a, w);

mag = abs(H);
pha = angle(H);

figure
subplot(211);
plot(w,mag);title('Magnitude');xlabel('rad/s');
subplot(212)
plot(w,pha);title('Phase');xlabel('rad/s');

figure
w_Hz = w*Fs/(2*pi); %frequency in unit of Hz.
subplot(211);
plot(w_Hz,mag);title('Magnitude');xlabel('Hz');
subplot(212)
plot(w_Hz,pha);title('Phase');xlabel('Hz');

Result:

Pole-zero plot

Magnitude and phase responses with frequency in rad/s.

Magnitude and phase responses with frequency in Hz.

References:

How to plot the magnitude and phase of a given transfer function(z-domain)?
Pole-Zero plots of various filters
draw the Pole-Zero plot of the Z-transform